Trading Tips
Candlestick Patterns Every Beginner Trader Must Know (With Simple Examples)
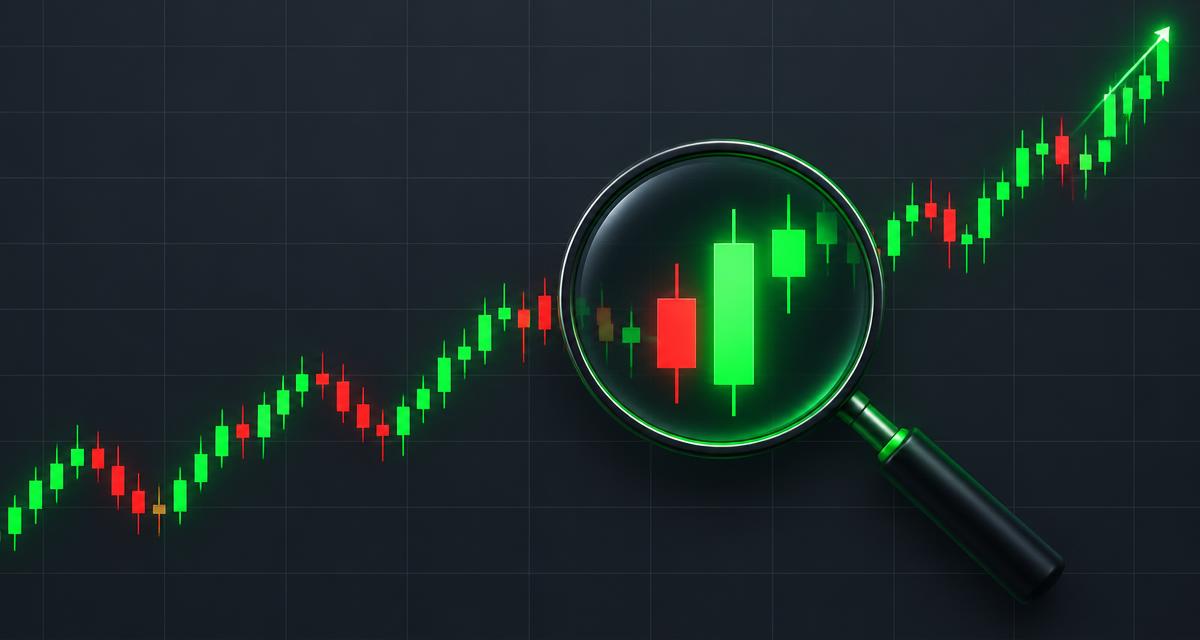
Open any forex or gold chart and you will see the same thing: green and red candles. These candles are not random shapes. Each one tells a short story about the fight between buyers and sellers. Learning to read a few key candlestick patterns is one of the fastest ways to understand what a chart is telling you.
This guide covers the 6 candlestick patterns every beginner should know, with simple explanations of what they mean and when they actually work.
First: What One Candle Tells You
Every candle shows four prices for its time period:
- Open — where the price started
- Close — where the price ended
- High — the highest point (top of the wick)
- Low — the lowest point (bottom of the wick)
A green (bullish) candle means the price closed higher than it opened — buyers won that period. A red (bearish) candle means sellers won. The body is the thick part between open and close; the wicks (shadows) show how far price travelled before pulling back.
A long body means strong conviction. Long wicks mean rejection — the market tried to go somewhere and was pushed back.
1. The Doji — Indecision
A doji has a tiny body: the open and close are almost the same price. It means neither buyers nor sellers won — the market is undecided.
When it matters: after a long strong move, a doji can warn that the move is running out of energy. On its own in the middle of a quiet range, it means nothing.
2. The Hammer — Rejection of Lower Prices
A hammer has a small body at the top and a long lower wick — at least twice the body length. It appears after a fall. Sellers pushed the price down hard, but buyers dragged it back up before the candle closed.
When it matters: at a clear support level after a downtrend, a hammer hints the selling may be done. In the middle of nowhere, ignore it.
3. The Shooting Star — Rejection of Higher Prices
The opposite of a hammer: small body at the bottom, long upper wick, appearing after a rise. Buyers pushed up, sellers slammed the price back down.
When it matters: near a resistance level after an uptrend, it warns that buyers are losing control.
4. Bullish Engulfing — Buyers Take Over
A small red candle followed by a large green candle whose body completely covers (engulfs) the previous red body. Sellers were in control, then buyers overwhelmed them in one period.
When it matters: at support or after a pullback in an uptrend, it is one of the more reliable reversal hints beginners can spot.
5. Bearish Engulfing — Sellers Take Over
The mirror image: a small green candle swallowed by a larger red one. Strong warning sign when it prints at resistance after a rally.
6. The Marubozu — Total Control
A marubozu has a full body with almost no wicks. A green marubozu means buyers controlled the entire period from open to close; a red one means total seller control.
When it matters: it shows momentum. A marubozu breaking through a level often means the break is real, not a fake-out.
The 3 Mistakes Beginners Make With Patterns
- Trading the pattern without the location. A hammer in the middle of a range is noise. The same hammer at a strong support level is a signal. Location first, pattern second.
- Using tiny timeframes. Patterns on the 1-minute chart fail constantly. The same patterns on the 1-hour or 4-hour chart are far more meaningful because more traders are watching them.
- Forgetting risk management. No pattern works 100% of the time. Every trade still needs a stop loss and a sensible position size. Use our position size calculator before entering, and read our guide on how to set stop loss and take profit.
How to Practice
Open a free demo account, pull up the EURUSD or XAUUSD 4-hour chart, and just mark patterns for a week without trading. Note what happened after each one. You will quickly see that patterns work best at clear support and resistance — and fail in choppy, directionless markets.
If you are ready to practice on a real platform, open a free Exness demo account here — it takes a few minutes and you can trade with virtual money until reading candles feels natural.
Want the full foundation first? Work through the free lessons in our Trading Academy, or ask our AI Tutor to explain any pattern you are stuck on.
Educational content only — not financial advice. Trading involves risk of loss.