Trading Tips
Reading Candlestick Charts: A Beginner's Guide to Price Action
Why Candlesticks Matter
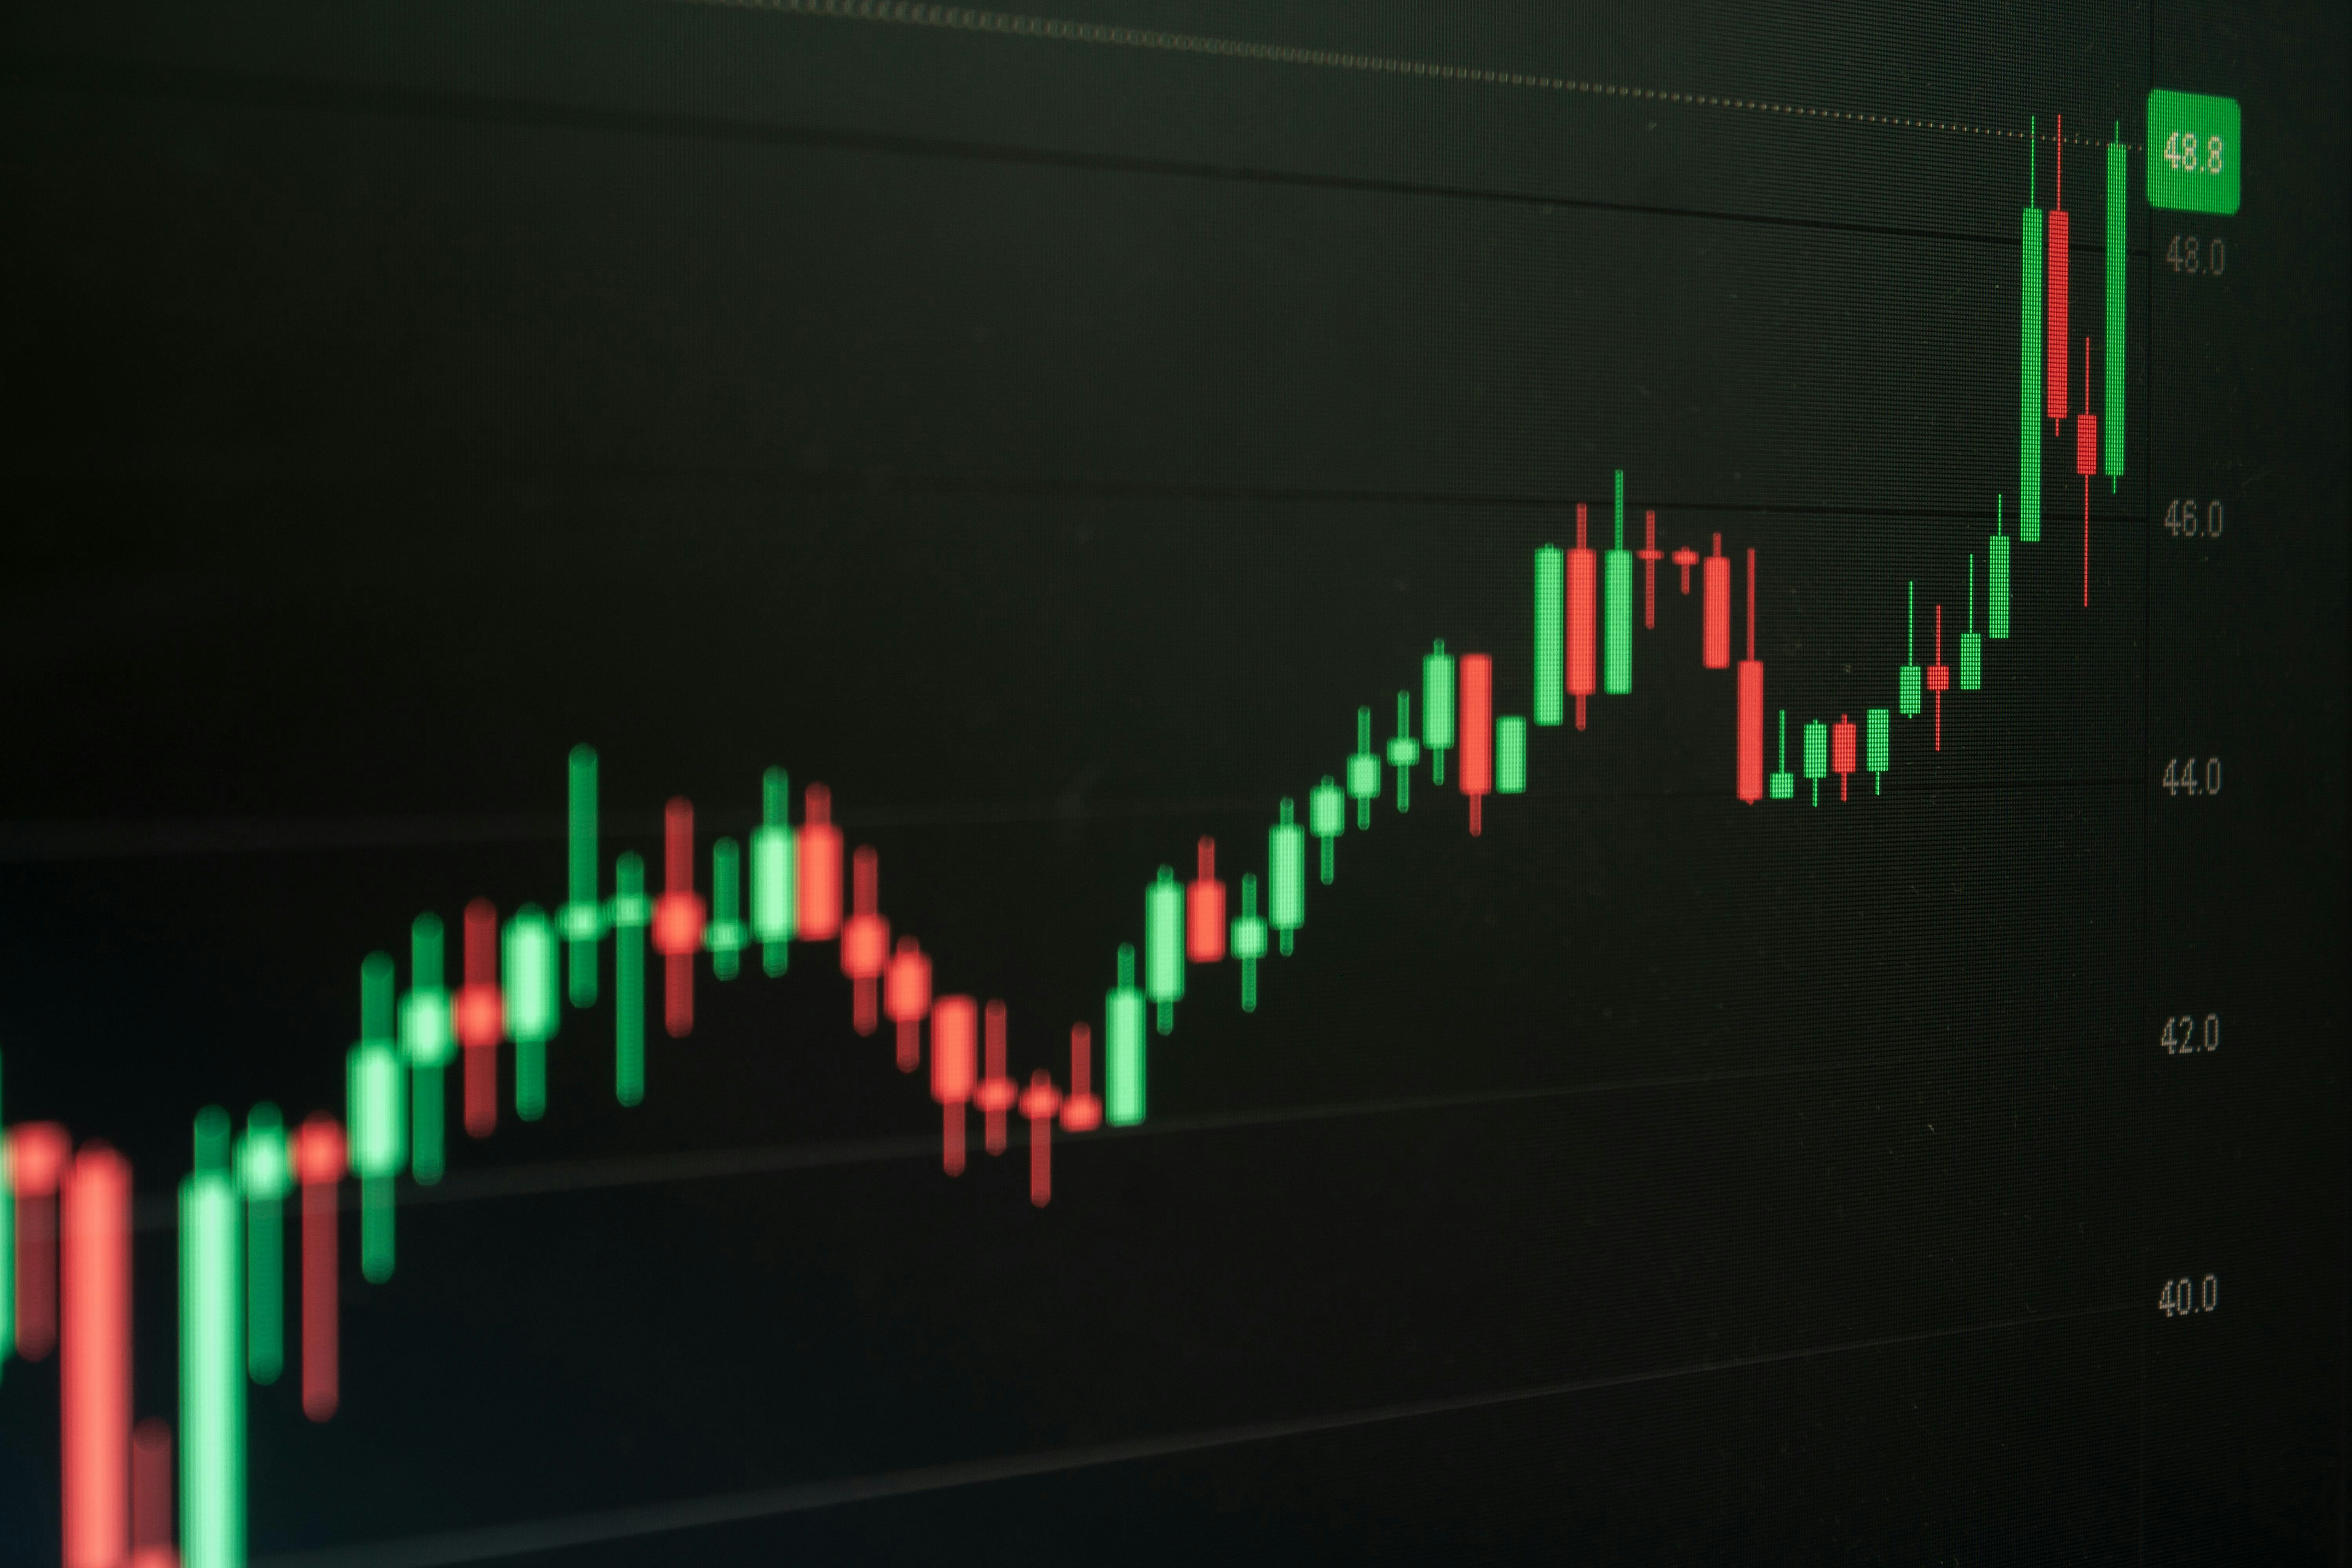
A candlestick isn't just a colored bar on a chart — it's a visual summary of buyer and seller behavior over a specific period. Learning to read them is one of the most useful skills for any beginner trader.
The Anatomy of a Candle
- Body: the range between the open and close price. A green/white body means price closed higher than it opened; a red/black body means it closed lower.
- Wicks (shadows): the thin lines above and below the body show the highest and lowest price reached during that period.
- Long wicks often signal rejection — price tried to go further but was pushed back.
Common Patterns Worth Knowing
- Doji: open and close are nearly equal, showing indecision between buyers and sellers.
- Engulfing candle: a candle that fully "engulfs" the previous one, often signaling a potential reversal.
- Pin bar (hammer/shooting star): a small body with a long wick, showing strong rejection of a price level.
Context Matters More Than the Pattern Alone
A bullish engulfing candle in the middle of nowhere means far less than the same pattern forming at a key support level or after a strong downtrend. Always read candlestick patterns together with the overall trend and key levels — never in isolation.
A Simple Way to Practice
Open a chart, cover the right side of the screen, and try to predict what the next candle will look like based on the pattern you see. Over time, this builds real pattern recognition — not just theory.
The Bottom Line
Candlesticks won't predict the future with certainty, but they give you a read on market psychology in real time. Combine them with structure and risk management for the best results.
Trading involves risk. This article is educational, not financial advice.