Trading Tips
How to Read a Forex Chart: Candlesticks, Timeframes and Trends for Beginners
How to Read a Forex Chart: Candlesticks, Timeframes and Trends for Beginners
Every trader starts in the same place: staring at a screen full of candles and wondering what any of it means. The good news is that reading a forex chart is a skill you can learn in one afternoon. Once you understand three things — candles, timeframes, and trend — the chart stops looking like noise and starts telling a story.
This guide walks you through exactly what to look at, in what order, so you can open any chart on XAUUSD, EURUSD or GBPUSD and describe what is happening in plain words.
What a Forex Chart Actually Shows
A forex chart is simply a record of price over time. The horizontal axis is time (minutes, hours, days), and the vertical axis is price. Each element on the chart represents one completed period: one minute, one hour, one day, depending on the timeframe you choose.
There are three common chart types:
- Line chart — connects closing prices with a line. Clean, but it hides what happened inside each period.
- Bar chart (OHLC) — shows open, high, low, and close as small bars. Accurate but hard for beginners to read quickly.
- Candlestick chart — the standard for forex traders. It shows the same four prices but in a visual way that is instantly readable.
Almost every professional chart you will see uses candlesticks, so that is where we will spend our time.
Anatomy of a Candlestick
Each candle represents four prices for its period:
- Open — the first price of the period
- High — the highest price reached
- Low — the lowest price reached
- Close — the final price
The wide part of the candle is called the body. It spans from open to close. The thin lines sticking out are called wicks (or shadows), and they show the high and low.
Bullish candle (usually green): the close was higher than the open. Buyers won the period.
Bearish candle (usually red): the close was lower than the open. Sellers won the period.
What each part tells you:
- A long body means strong, one-sided movement.
- A small body means indecision — price moved but went nowhere.
- A long upper wick means buyers pushed price up, but sellers pushed it back down before the close. That is rejection of higher prices.
- A long lower wick means sellers pushed price down, but buyers stepped in and recovered. That is rejection of lower prices.
You do not need to memorize dozens of candle names on day one. Start by reading the message of body size and wick position: who controlled the period, and where was price rejected?
Timeframes: Which One Should You Watch?
Timeframes are zoom levels. The same market looks completely different on a 5-minute chart and a daily chart — both are correct, they just show different scales of movement.
Common timeframes and who uses them:
| Timeframe | Typical use |
|---|---|
| 1M – 15M | Scalping; very fast, very noisy |
| 30M – 1H | Short-term intraday trading |
| 4H – Daily | Swing trading; the sweet spot for most beginners |
| Weekly – Monthly | Long-term context and major levels |
A habit that will save you months of confusion: look at higher timeframes first, then zoom in. For example, check the daily chart of XAUUSD to see the big direction, then drop to the 1-hour chart to find an entry that agrees with it. This is the core idea behind multi-timeframe analysis, and it is how most experienced traders avoid fighting the bigger trend.
Beginners should also know that lower timeframes are noisier. A 1-minute chart produces signals every few minutes, most of them meaningless. Starting on the 1-hour and 4-hour charts slows everything down and makes learning far easier.
Trend: The Most Important Word on the Chart
Trend is simply the direction price is traveling overall. You do not need an indicator to see it — you need to answer one question: are the highs and lows getting higher, lower, or staying flat?
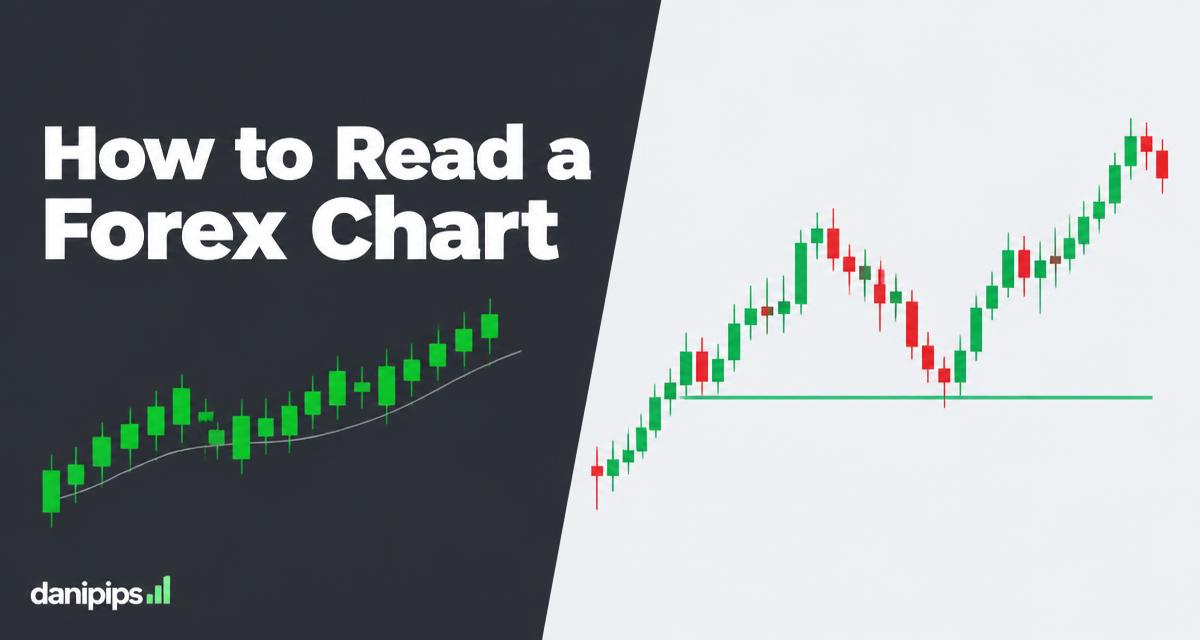
- Uptrend: higher highs and higher lows. Each pullback stops above the previous low. Buyers are in control.
- Downtrend: lower highs and lower lows. Each bounce stops below the previous high. Sellers are in control.
- Range: price is bouncing between a horizontal ceiling and floor. Neither side is winning.
When the chart is in a clear uptrend, the highest-probability simple trade is buying pullbacks — waiting for price to dip back toward the last area that held, then looking for the rise to continue. When it is in a range, the edges of the range matter; the middle is where traders get chopped up.
If you cannot describe the trend in one sentence ("XAUUSD is making higher highs and higher lows on the 4-hour"), you are not ready to place a trade on that chart. That single sentence is the difference between trading and guessing.
Support and Resistance: Where Price Tends to React
As you read a chart, your eyes will notice levels where price keeps turning. Those are support (a floor where buying has repeatedly stepped in) and resistance (a ceiling where selling has repeatedly stepped in).
Practical rules for spotting them:
- Draw them at obvious swing points — the tops and bottoms price has respected more than once.
- On higher timeframes (4H, daily), levels are far more reliable than on lower ones.
- Levels do not have to be exact lines; think of them as zones.
- When resistance breaks, it often starts acting as support, and vice versa.
Reading a chart well is mostly about combining the pieces: the trend tells you which direction to favor, support and resistance tell you where price is likely to react, and the candles tell you whether buyers or sellers are winning at that moment.
A Simple Reading Routine You Can Use Today
Here is a five-step routine for any chart, on any pair:
- Zoom out. Open the daily chart. Is price making higher highs/lows (uptrend), lower highs/lows (downtrend), or moving sideways (range)?
- Mark the obvious levels. Draw the two or three most obvious horizontal levels where price has turned multiple times.
- Zoom in. Move to the 4-hour or 1-hour chart. Does the smaller picture agree with the bigger one?
- Read the candles. At the level you care about, are you seeing strong bodies in the trend direction, or long wicks showing rejection?
- Say it out loud. If you cannot describe setup, direction and level in one or two sentences, skip the trade.
Notice that this routine contains no indicators at all. Price action comes first; indicators like moving averages or RSI are only assistants that add context on top of what the chart already shows.
Common Beginner Mistakes When Reading Charts
- Staring at one timeframe only. A "great setup" on the 5-minute chart may be a tiny pullback inside a heavy daily downtrend.
- Seeing signals in noise. On low timeframes, every wick looks important. Ask what the daily chart thinks before anything else.
- Drawing ten levels. Mark the obvious ones. If you need a magnifying glass to argue why a level matters, it does not.
- Changing chart type. Stick with candlesticks. Switching between chart types mid-analysis breaks your consistency.
- Trading without a story. If your reason for entering cannot survive being explained to a friend, it is not a reason.
Practice Before You Risk Anything
Reading charts is a skill built by repetition, and there is no need to risk money while learning. Open a free demo account and spend one week doing nothing but the five-step routine above, once per session, on one pair. Take screenshots, write one sentence describing the trend, and mark your levels. By the end of the week you will read charts faster than most traders who have been active for months.
You can open a free demo in about five minutes — we walk through it step by step in our Exness demo account guide, or you can go directly here: Open a free Exness account. Demo trading lets you practice reading candles, timeframes and trends with virtual money, so when you go live you are already fluent.
Key Takeaways
- A candle shows open, high, low and close — the body tells you who won, the wicks tell you where price was rejected.
- Timeframes are zoom levels; always check the higher timeframe before the lower one.
- Trend = are highs and lows rising, falling, or flat? If you cannot name it, you cannot trade it.
- Support and resistance are the levels where price tends to react; draw only the obvious ones.
- Practice the five-step reading routine on a free demo account until it becomes automatic.
Charts stop being intimidating the moment you stop looking for a magic signal and start reading them the way they are written: trend first, levels second, candles third. Follow that order on every chart you open, and the picture will always make sense.