Trading Tips
Support and Resistance in Forex: A Beginner’s Guide
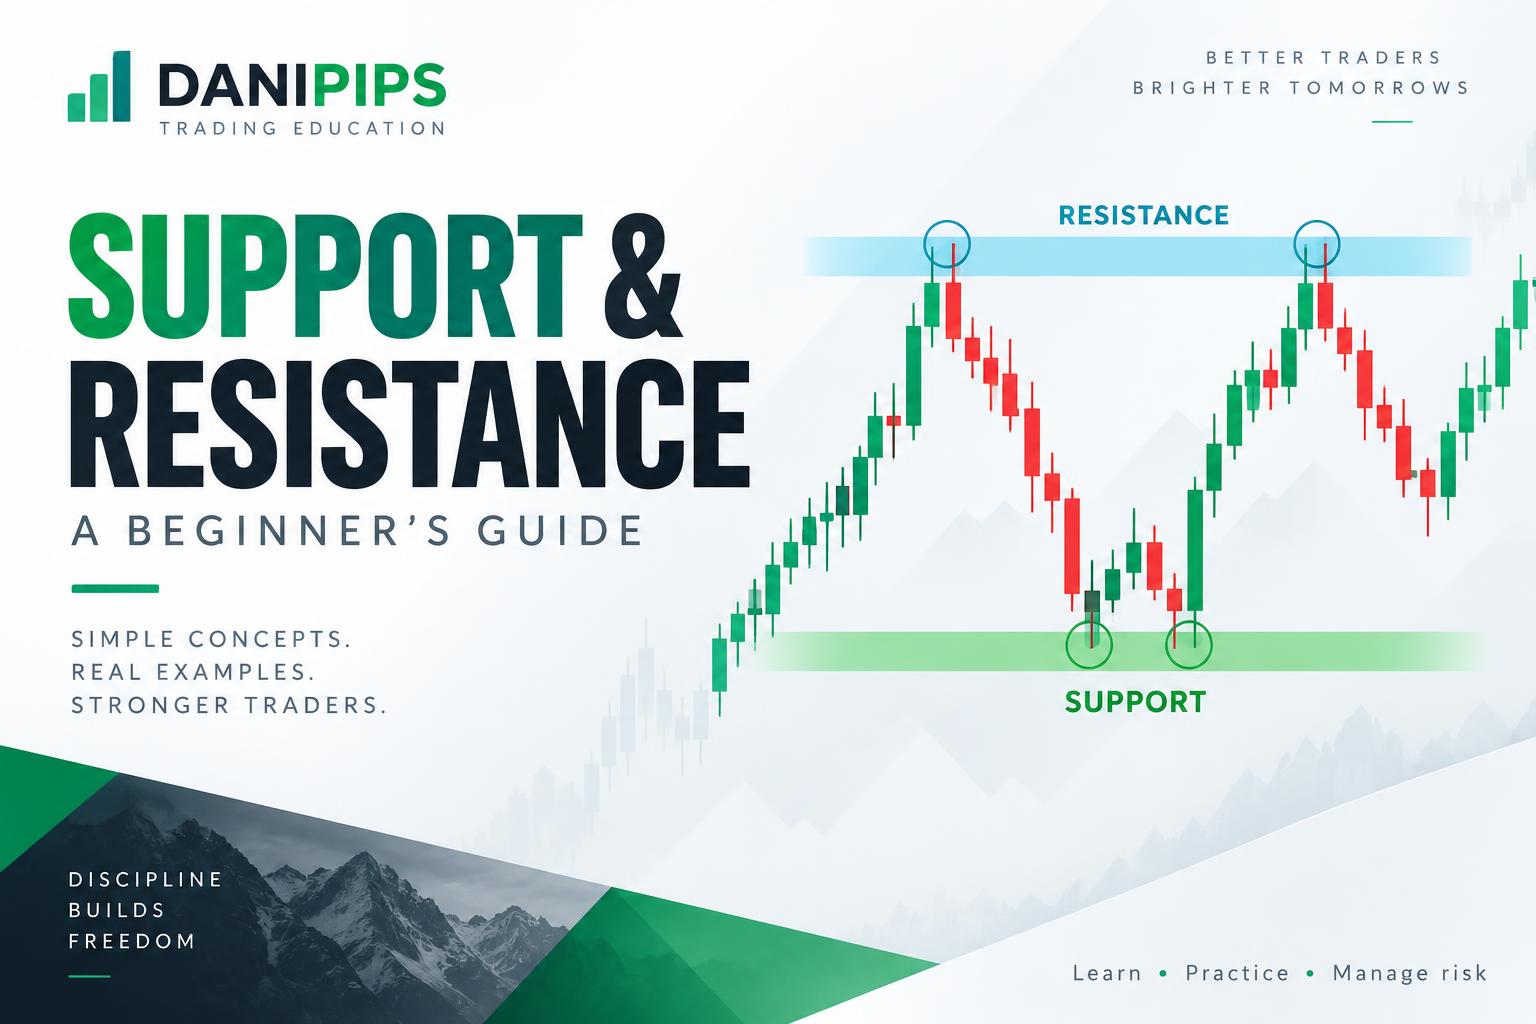
Support and resistance are among the first chart-reading skills a beginner learns—and among the easiest to misuse. They can help you organise a trade idea, but they do not predict the next candle or guarantee a bounce. This guide explains how to identify useful zones, recognise a failed breakout and turn a chart observation into a risk-controlled plan.
What are support and resistance?
Support is an area where falling prices previously met enough buying interest to pause or reverse. Resistance is an area where rising prices previously met enough selling interest to pause or reverse. These descriptions refer to past behaviour, not promises about future orders.
Think of them as zones rather than perfectly precise lines. A market can briefly cross a previous high or low without establishing a sustained breakout. Spread, volatility and the timeframe all affect what a test looks like. The banner above is an illustration, not a current market chart or a trade signal.
How to draw useful zones in five steps
- Start with the larger picture. Review a daily or four-hour chart to see whether price is trending or ranging. These are practice choices, not mandatory timeframes.
- Mark obvious turning points. Look for clear swing highs and lows where price changed direction meaningfully. Avoid marking every tiny fluctuation.
- Group nearby reactions. If several turning points sit close together, draw a narrow zone around them rather than forcing every candle onto one price.
- Check the recent context. Ask whether price has moved decisively away from the area or repeatedly returned to it. More tests do not automatically make a level stronger; repeated tests can also consume available liquidity.
- Keep the chart readable. Retain only the nearby zones relevant to your planned trade and timeframe. A chart covered in lines can make almost any outcome appear predictable after the fact.
The zone width should reflect the market and timeframe. There is no universal five-pip or ten-pip width suitable for every forex pair, and forex pip distances should not be transferred directly to gold.
Support and resistance in trends versus ranges
In a range, price has recently rotated between an upper and lower area. A trader might study reactions near those edges, but a range can end abruptly. Buying merely because price touched the lower edge ignores the possibility of a genuine downside breakout.
In an uptrend, a previous resistance area may later act as support after price breaks above it. In a downtrend, previous support may become resistance. This is often called a role reversal. It is a possibility to investigate, not a rule that every broken level must follow.
Read candlestick patterns for beginners to understand what a candle can—and cannot—tell you about a reaction. A familiar candle pattern is not sufficient evidence by itself.
Breakout, retest or false breakout?
A breakout occurs when price moves beyond a zone. Some traders wait for a candle to close beyond it; others use different confirmation criteria. Waiting can filter some noise, but it can also create a later entry and does not eliminate losses.
A retest is a return toward the broken area. Retests do not always occur. Chasing a move because you fear missing it can lead to a stop distance and position size that no longer fit your plan.
A false breakout is a move beyond an area that fails to hold and returns inside it. Do not assume you can recognise one in advance. Decide beforehand what observation would invalidate your trade idea.
Scheduled news can cause sharp moves, wider spreads and slippage around these zones. Check the economic news and calendar page, and read how to trade around major news events.
Worked EUR/USD example: zone first, position size second
The following prices are hypothetical and are not a recommendation to trade EUR/USD. Assume a USD-denominated account and a standard forex contract of 100,000 base-currency units per lot. Confirm your broker’s symbol specifications before applying the calculation.
Suppose you marked support around 1.0800–1.0810. You observe a reaction and plan an illustrative long entry at 1.0820, with a stop at 1.0790, below the zone. The distance between entry and stop is 0.0030, or 30 pips when one pip equals 0.0001.
With a hypothetical $1,000 account and an example risk budget of 1%, the planned price-movement loss is $10. This percentage is an illustration, not a recommendation for every reader. Under the contract assumptions above, EUR/USD has a pip value of approximately $10 per standard lot in a USD account.
Position size = $10 ÷ (30 pips × $10 per pip per lot) = 0.0333 lots.
If the platform permits only 0.01-lot increments, rounding down to 0.03 lots produces approximately $9 of price-movement risk at a 30-pip stop. It does not guarantee the total loss stays below $10: commissions, execution prices and slippage can change the realised result. Use executable entry and exit prices so you do not double-count spread already included in your stop distance. A stop order can fill worse than requested during a fast move or gap.
An illustrative target at 1.0880 is 60 pips above the entry—twice the 30-pip stop distance before costs. If resistance is much closer, that target may not fit the chart. A 2:1 reward-to-risk ratio alone does not make a strategy profitable; outcomes, win rate and costs also matter.
Use the position-size calculator and pip-value calculator with the correct symbol and account details. Compare the result with your platform’s contract specification.
Five mistakes that make these levels less useful
- Treating every touch as an entry. A zone is a location to observe, not an instruction to buy or sell.
- Moving the stop to avoid admitting a failed idea. A wider stop changes your risk. Do not keep the same position size and pretend the plan is unchanged.
- Drawing levels only after a move. Mark them before your practice trade and save the chart so your review is honest.
- Ignoring spread and news. A candle chart may use bid, ask or midpoint prices. Know what your platform displays and which price triggers your orders.
- Copying exact forex distances into XAU/USD. Gold has different quoting and contract conventions. Review gold position sizing and confirm the actual symbol specification.
For order placement basics, read how to set stop loss and take profit. For trading costs, read why trades start negative.
A practical demo-account checklist
Before placing a practice order, write down the market context, your zone, the observation that would justify an entry, and what would invalidate the idea. Then record your intended entry, stop, target, position size and cost assumptions. If the minimum trade size exceeds your risk budget, skip the trade rather than forcing a tighter stop.
After the trade, save a screenshot and note whether you followed the plan. Review a series of practice trades across different conditions. A few successful bounces do not establish a reliable edge.
Start with the free forex course, explore the Trading Academy, or bring a specific example to the Danipips AI Tutor. Do not share account passwords or sensitive financial information in a chat.
Frequently asked questions
Which timeframe is best for support and resistance?
There is no universally best timeframe. Larger timeframes can make broad turning points easier to see; smaller ones show more detail and noise. Match the timeframe to your intended holding period and use consistent rules during practice.
Should I use candle bodies or wicks?
Both can provide context. Wicks show the extremes reached; bodies show opening and closing prices. A zone covering a cluster of reactions is often more honest than choosing one exact line to make the history look perfect.
Does broken resistance always become support?
No. Price may retest it, fail immediately, continue without a retest or move into a new range. Role reversal is a scenario, not a guarantee.
Can support and resistance work on gold?
The same chart concepts can be studied on gold, but its volatility and symbol specifications differ. Use an XAU/USD-specific position-size calculation and account for the possibility of rapid moves.
Can I practise with an Exness demo account?
You can check whether Exness offers a demo account suitable for your country and the platform you want to use. Check eligibility and current terms directly. Explore Exness through the Danipips referral link. Affiliate disclosure: this is a referral link; Danipips may receive compensation if you sign up or trade through it. This does not guarantee account approval, trading results or service availability in your region.
The takeaway
Support and resistance help you describe where price reacted before. The useful skill is combining that observation with a clear invalidation point, appropriate position sizing and an honest review—not predicting that a line will hold forever. Practise first and skip trades that do not fit your plan.
Risk warning: leveraged forex and CFD trading can cause substantial losses. This article is educational, not personalised financial advice or a trade signal. All numerical examples are hypothetical; actual costs, contract specifications and execution conditions vary.