Trading Tips
Moving Averages Explained: How SMA and EMA Show You the Trend
If you have opened a forex chart, you have almost certainly seen a moving average — even if you did not know what it was called. It is the smooth, curving line that flows through or around the candles, and it is the most widely used indicator in the world. Traders love it because it answers one simple question: which direction is the market moving right now?
In this guide you will learn what moving averages are, how SMA and EMA differ, which settings beginners should start with, and — just as importantly — how they are misused.
What a Moving Average Actually Is
A moving average takes the closing prices of the last N candles and averages them. Plot that average for every candle and you get a line that follows the price but smooths out the noise.
For example, a 20-period moving average on a 1-hour chart averages the last 20 hourly closes. Every new candle, the oldest price drops out and the newest one joins — that is why the line "moves."
Because it averages past prices, a moving average always lags the market. It never predicts. It describes. That single fact explains both its power (it filters noise) and its weakness (it is always a little late).
SMA vs EMA: What Is the Difference?
Both do the same job, but they weight prices differently:
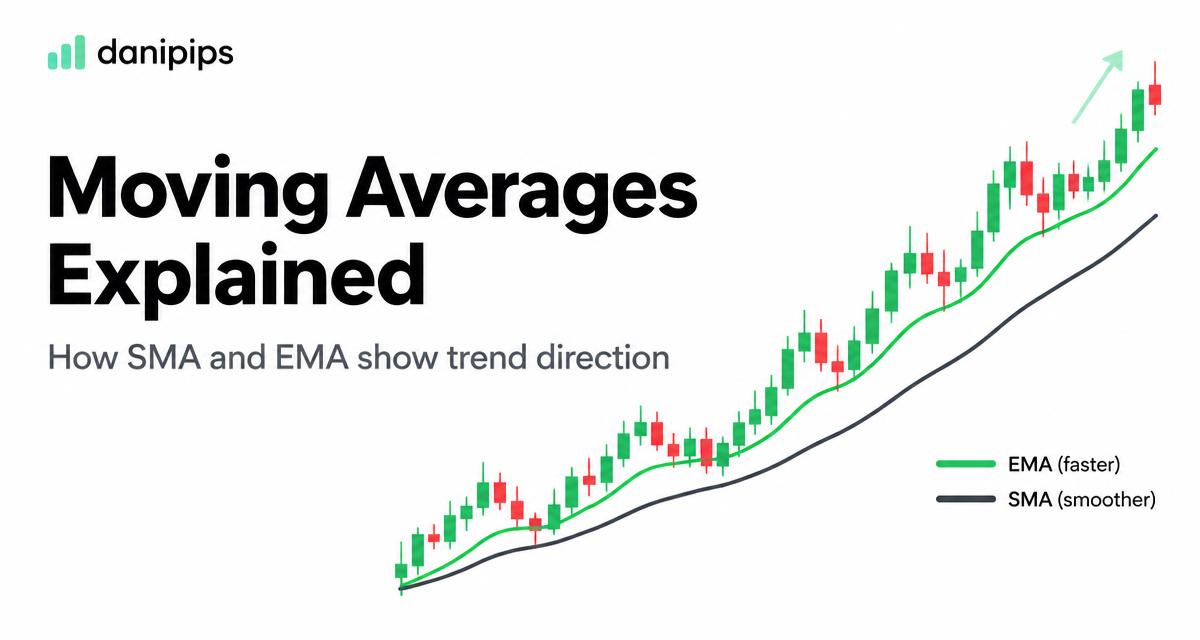
- SMA (Simple Moving Average) treats every price in the period equally. A close from 19 candles ago counts exactly as much as the latest one. It is smooth and stable, but slow to react.
- EMA (Exponential Moving Average) gives more weight to recent prices. It turns faster when the market changes direction, but that speed also makes it react to noise.
There is no "better" one — they are tools for different jobs. If you want fewer signals and a calmer read of the trend, lean toward the SMA or a longer EMA. If you want earlier (but noisier) signals, lean toward the EMA.
A common beginner-friendly approach is to use a faster EMA (like 20) with a slower EMA (like 50): the fast line shows short-term momentum, the slow line shows the underlying trend.
The Settings You Will See Everywhere
On platforms like Exness's MetaTrader, you will see the same three periods again and again:
- 20 — short-term trend. On a daily chart, 20 days is roughly one trading month.
- 50 — medium-term trend. The classic "swing trading" reference line.
- 200 — the long-term trend line. Institutions and commentators quote it constantly; price above a rising 200 EMA is broadly read as a bullish market.
You do not need all of them. A 1-hour trader using the 20 EMA + 50 EMA has everything they need; a 200 EMA on a 5-minute chart means almost nothing.
How Traders Actually Use Moving Averages
1. As a trend filter
This is the most honest use of the indicator. Ask one question: is price above or below the moving average, and is the line rising or falling?
- Price above a rising 50 EMA → look for long setups only.
- Price below a falling 50 EMA → look for short setups only.
Many traders combine this with support and resistance — only taking buy signals that happen above the trend line, and sell signals below it. Our guide to support and resistance pairs naturally with this filter.
2. As dynamic support and resistance
In a healthy trend, price keeps pulling back to the moving average and bouncing off it. The 20 EMA on a 4-hour chart often behaves like a moving floor in an uptrend. When price closes far away from the average, many traders read that as an overextended market that may snap back toward it.
3. Crossovers (with a warning)
When the fast EMA crosses above the slow EMA, some traders read it as a buy signal; the reverse as a sell signal. Crossovers are simple to automate, which is why they are popular — but they are also late. By the time a 20/50 crossover prints, a chunk of the move has already happened, and in sideways markets crossovers fire again and again while price goes nowhere.
If you use crossovers, use them as confirmation of a trend you identified another way — never as your only signal.
The Honest Limitations
Before you trust any indicator, know where it fails:
- Moving averages lag. They describe what already happened.
- In ranging markets they fail. Price whips across the average and every crossover loses. No indicator works in every condition — the skill is knowing which regime you are in.
- They are not a strategy. A moving average is a filter, not a reason to trade. "Price is above the EMA" is not a trade; "price pulled back to the 20 EMA inside an uptrend, rejected, and my stop is below the last swing low" is closer to a trade.
If you want to go deeper on indicators, our RSI beginner's guide covers momentum, which complements trend filters like this one. The Academy also has a full lesson on moving average basics.
Three Mistakes Beginners Make With Moving Averages
- Stacking five averages on one chart. Two is enough. More lines do not add information, they add confusion.
- Trading every crossover. In a range, crossovers will chop you to pieces. Check first whether the market is trending at all.
- Using them without a stop. A trend filter does not protect your account — position sizing and stop losses do. The 1% rule and a stop placed beyond the last swing high/low are what keep one bad signal from becoming a bad week.
How to Practice This Safely
Moving averages are best learned by watching, not reading. Open a demo account, mark the 20 and 50 EMA on one pair (EUR/USD and gold are good places to start), and simply observe: How often does price respect the average? How long does a trend last after a crossover? How do the lines behave when the market goes sideways?
When you are ready to practice with a live account, start small. A regulated broker with tight spreads matters more than any indicator — we use Exness and recommend opening your account here: https://one.exnessonelink.com/a/ze7shkmda2?platform=mobile. Keep your risk per trade at 1% or less, and size your positions before you enter, not after — our position sizing guide shows exactly how.
And if you are starting from zero, the free forex course builds all of this up step by step, from pips to your first managed trade.
---
Moving averages describe the past; your risk management decides your future. Nothing here is financial advice — trade what you can afford to lose.