Trading Tips
RSI Indicator in Forex: A Beginner’s Guide
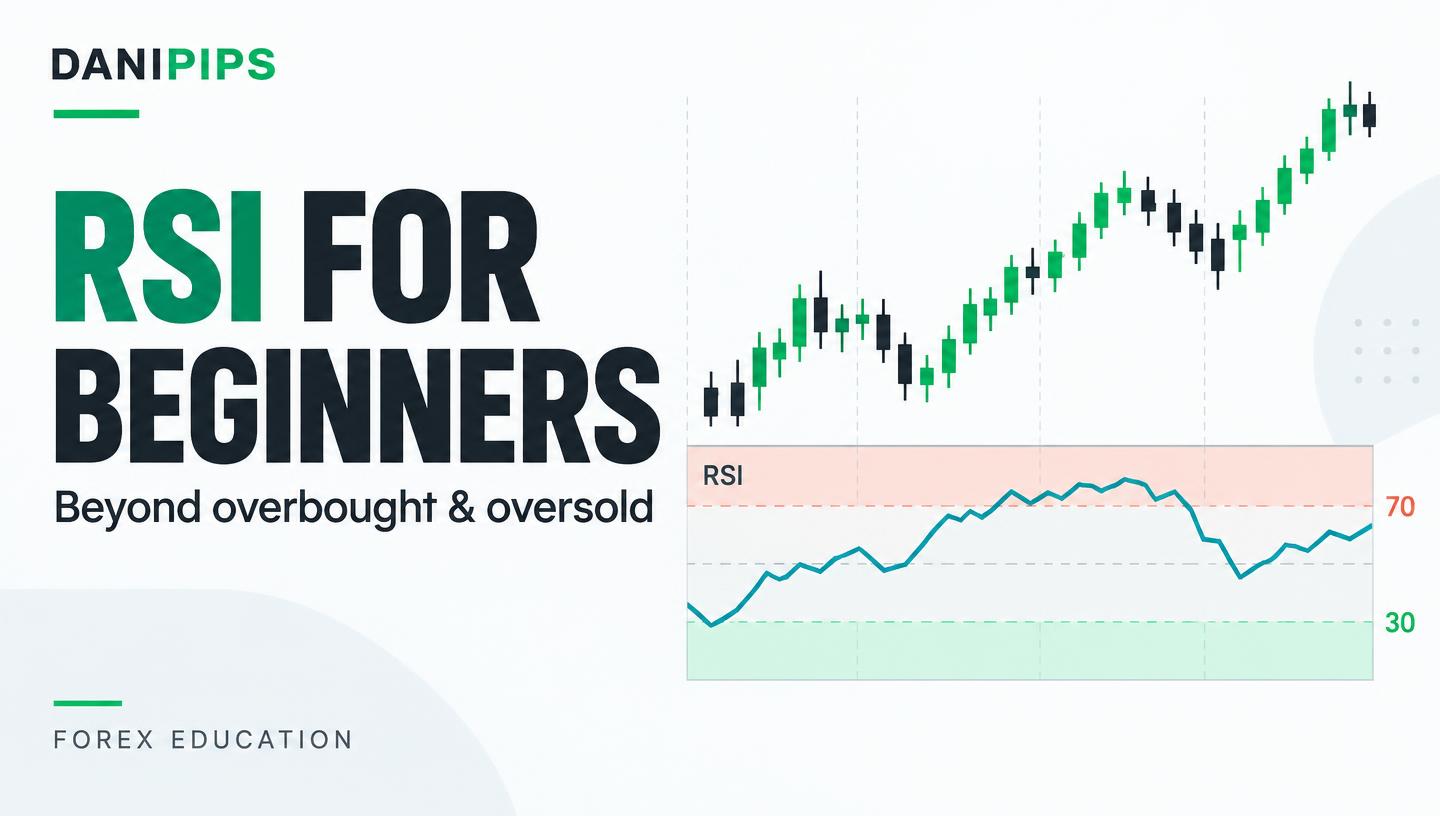
The Relative Strength Index (RSI) is one of the most familiar indicators on a forex chart. Yet the advice beginners often hear — “buy below 30 and sell above 70” — leaves out the most important detail: a strong trend can keep moving long after RSI reaches an extreme.
This guide explains how to read the RSI indicator in forex, what the common settings mean, and how to practise without treating an indicator as a promise of profit. The chart in the banner is illustrative, not a live quote or a trading recommendation.
What is RSI in forex?
RSI is a momentum oscillator developed by J. Welles Wilder Jr. It compares smoothed recent gains with smoothed recent losses and displays a value between 0 and 100. It measures the strength of recent price changes; it does not tell you the fair value of a currency or what the next candle will do.
The conventional calculation is RSI = 100 − 100 / (1 + RS), where RS is the ratio of smoothed average gains to smoothed average losses over the chosen period. Chart platforms handle the calculation, including the edge cases. Your job is to understand the reading in context.
RSI usually appears in a separate panel below the price chart. Read both panels together. Price structure, volatility, trading costs and scheduled news still matter.
What do 30, 50 and 70 mean?
- Above 70: commonly called overbought. Recent upward momentum is strong relative to downward momentum. It does not automatically mean price must fall.
- Below 30: commonly called oversold. Recent downward momentum is strong relative to upward momentum. It does not automatically mean price must rise.
- Around 50: recent gains and losses are more balanced under the indicator’s smoothing. Movement through 50 can help describe momentum, but is not a standalone entry signal.
The word “overbought” can be misleading. A currency pair is not necessarily expensive simply because its RSI is high. Likewise, “oversold” does not make a falling market a bargain.
What are the best RSI settings for beginners?
A 14-period RSI with reference levels at 30 and 70 is a conventional starting point, not a universally best setting. Keep that setting unchanged while you learn how the indicator behaves.
“14 periods” means 14 candles on your selected chart. On a one-hour chart it uses hourly price changes; on a daily chart it uses daily price changes. It does not always mean 14 days.
Shorter settings tend to react faster and produce more fluctuations. Longer settings tend to react more slowly. Switching settings after every losing trade makes it difficult to evaluate a repeatable process.
Choose one pair and a manageable chart timeframe for demo practice. A four-hour chart can provide fewer decisions than a five-minute chart, but no timeframe removes trading risk. Two platforms can also show slightly different values because their price feeds, candle boundaries or calculation implementations differ.
Why selling every reading above 70 can fail
Imagine EUR/USD is making higher highs and higher lows after a major shift in interest-rate expectations. RSI rises above 70, briefly dips, then returns above 70 while price continues upward.
A trader who sells only because the indicator is “overbought” is betting against an established trend without evidence that the trend has ended. Repeated short entries can lose even if RSI eventually returns to its middle range.
The opposite can happen in a downtrend. RSI may spend time below 30 while price makes new lows. Buying each low reading can turn a small mistake into a series of losses.
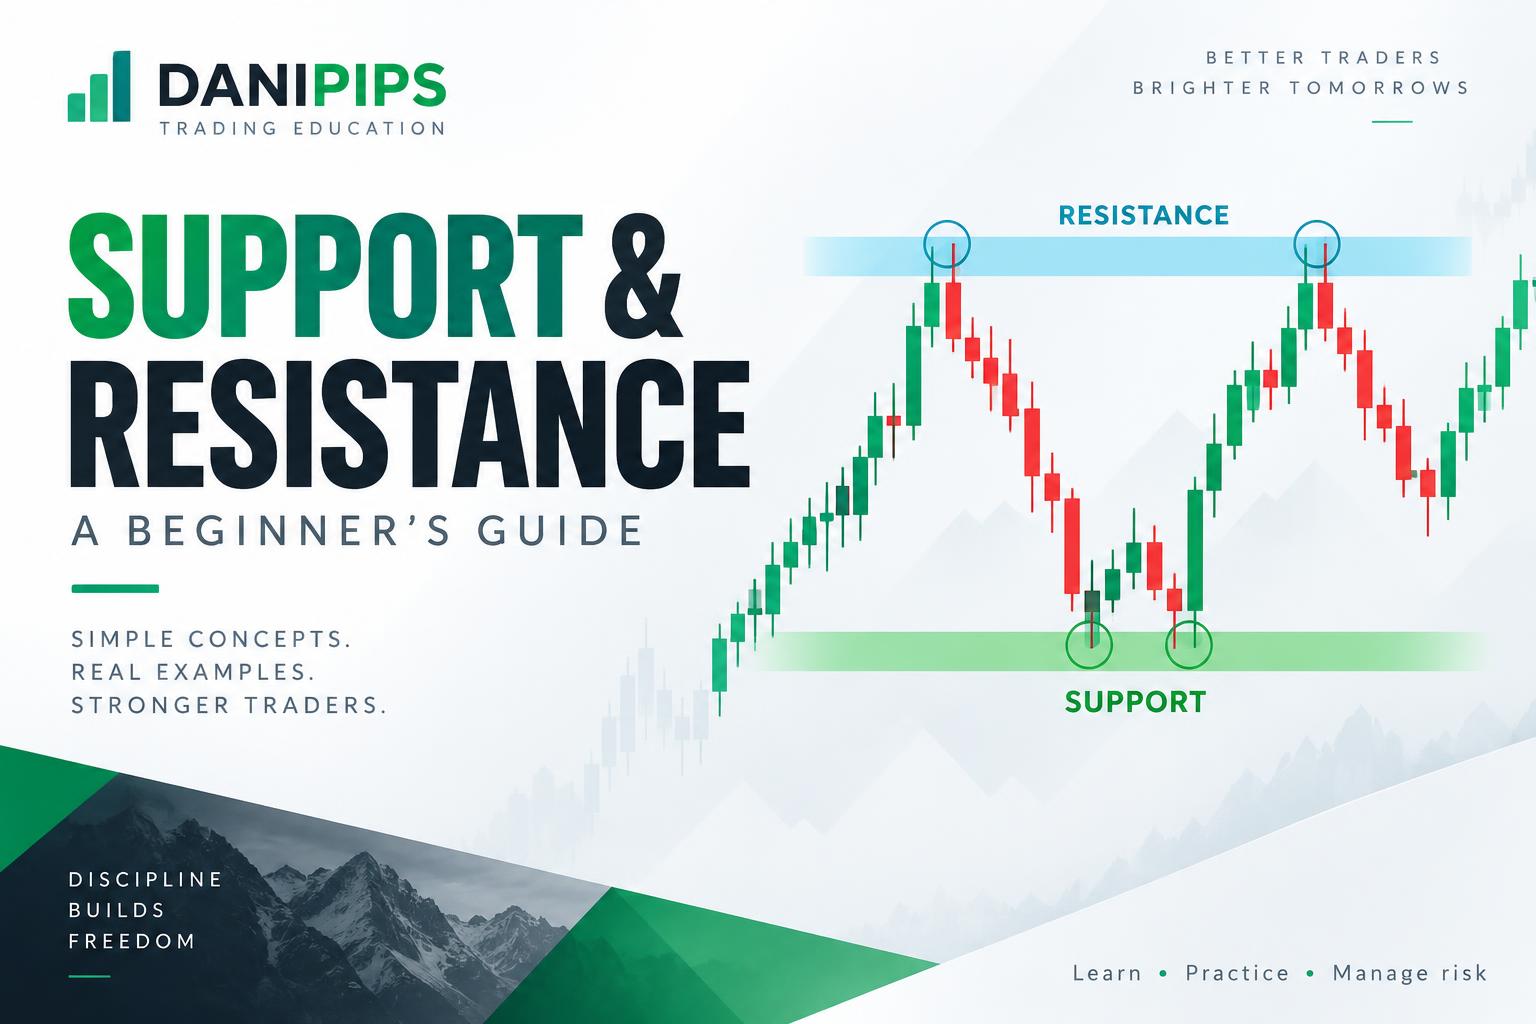
First ask whether price is trending or ranging. Our support and resistance guide explains how to identify areas where price has previously reacted.
An RSI practice checklist — not an automatic strategy
Use this checklist to build a demo observation process rather than a live buy-or-sell formula.
1. Read the price chart first
Mark the recent swing highs and lows. Look for higher highs and higher lows, lower highs and lower lows, or repeated movement between a range’s boundaries. If structure is unclear, skipping the setup is reasonable.
2. Identify the area that matters
An RSI reading near a previously observed support or resistance area may be more informative than the same reading in the middle of a range. These are zones, not guaranteed turning points. Price can break through them.
3. Check what RSI adds
Ask whether momentum is supporting the trend, weakening, or simply fluctuating. Avoid treating a brief move across 30, 50 or 70 as proof. A candle that is still forming can change the reading before it closes.
4. Wait for observable price behaviour
On a demo account, record what happens after a candle closes, a level is reclaimed, or a swing changes. Define your observation before the outcome is known. Our candlestick patterns guide explains useful chart vocabulary without promising that a pattern will work.
5. Define risk before considering an entry
An indicator cannot choose an appropriate position size. Decide where your idea would be invalidated, then calculate the position size that fits your planned monetary risk. A stop loss can reduce exposure but cannot guarantee its exact execution price during gaps or fast markets.
Use the position-size calculator and the stop-loss and take-profit guide. Check the symbol specifications and account currency before relying on a calculation.
What is RSI divergence?
Divergence means price and the oscillator are not making matching extremes.
- Regular bullish divergence: price makes a lower low while RSI makes a higher low. Downward momentum may be weakening.
- Regular bearish divergence: price makes a higher high while RSI makes a lower high. Upward momentum may be weakening.
Divergence is a warning to investigate, not confirmation of a reversal. It can appear several times while the original trend continues. It also depends on which swings you compare; cherry-picking different points can make a chart appear more convincing than it is.
Use clearly defined swing points in your journal and review them with the price structure. Do not keep moving the comparison points until a signal fits your preferred direction.
Can RSI help with gold trading?
RSI can describe momentum on XAUUSD, but it does not account for gold’s contract size, changing volatility, financing costs or news sensitivity. The same RSI reading can accompany very different price moves on gold and a currency pair.
Do not copy a forex position size into a gold trade. Contract specifications vary by broker and symbol. Read our gold lot-size guide and verify the example against the actual specifications in your platform.
Before analysing any instrument, check scheduled economic events. Rate decisions, inflation releases and employment reports can overwhelm an otherwise tidy technical setup. RSI cannot predict the result of a news announcement.
Five common RSI mistakes
- Trading every extreme: a reading above 70 or below 30 is context, not an order.
- Ignoring costs: spread, commission where applicable and slippage affect results. Read why trades can start negative.
- Changing settings repeatedly: constant adjustment can fit yesterday’s chart without improving future decisions.
- Adding indicators that repeat the same information: several momentum indicators agreeing is not necessarily independent evidence.
- Increasing size after a loss: a stronger-looking signal does not justify abandoning your risk limits.
A simple demo journal exercise
Pick one currency pair, one timeframe and one RSI setting. For each observation, record the date, price structure, nearby support or resistance, RSI reading at the candle close, scheduled news and a screenshot.
Write down what would invalidate the idea before looking at the later candles. Record skipped setups as well as attractive ones. Review enough observations to see both failures and successes, including hypothetical trading costs; a few winning examples do not establish a dependable edge.
If you choose to simulate trades, use the same risk rules throughout. Do not use a demo profit streak as a guarantee that you are ready for live trading.
Frequently asked questions
Is RSI below 30 a buy signal?
Not by itself. It describes relatively strong recent downward momentum. Price can keep falling, so inspect structure, news and risk before making a decision.
Is RSI above 70 a sell signal?
Not by itself. Strong trends can hold RSI near or above 70 for a prolonged period. An extreme reading does not prove that a reversal has started.
Can beginners use RSI without other indicators?
Yes, you can study RSI alongside the price chart without adding more indicators. You still need a defined process, realistic trading costs and risk management. More indicators do not automatically mean better decisions.
Does RSI work on every timeframe?
It can be calculated on many timeframes, but the reading changes with the candle interval. Short charts can be particularly sensitive to small fluctuations and costs. No timeframe or setting guarantees profitable trades.
Your next step
Start with the free forex course, build your chart-reading knowledge in the Danipips Academy, or ask the AI Tutor to explain an RSI concept. AI answers can be wrong; verify important details before acting.
If you want to explore a demo account, visit Exness through the Danipips partner link. Availability and account conditions depend on your country and the entity serving you. Check current terms directly before opening or funding an account.
Affiliate disclosure: Danipips may receive compensation if you register or trade through its partner link. This does not make an RSI setup reliable or guarantee a profit.
Risk warning: This article is educational, not personalised investment advice. Leveraged forex and CFD trading can cause rapid losses. Demo results do not guarantee live performance; only risk money you can afford to lose.