Trading Tips
Risk–Reward Ratio in Forex: How to Calculate 1:2, 1:3 and Break-Even Win Rate
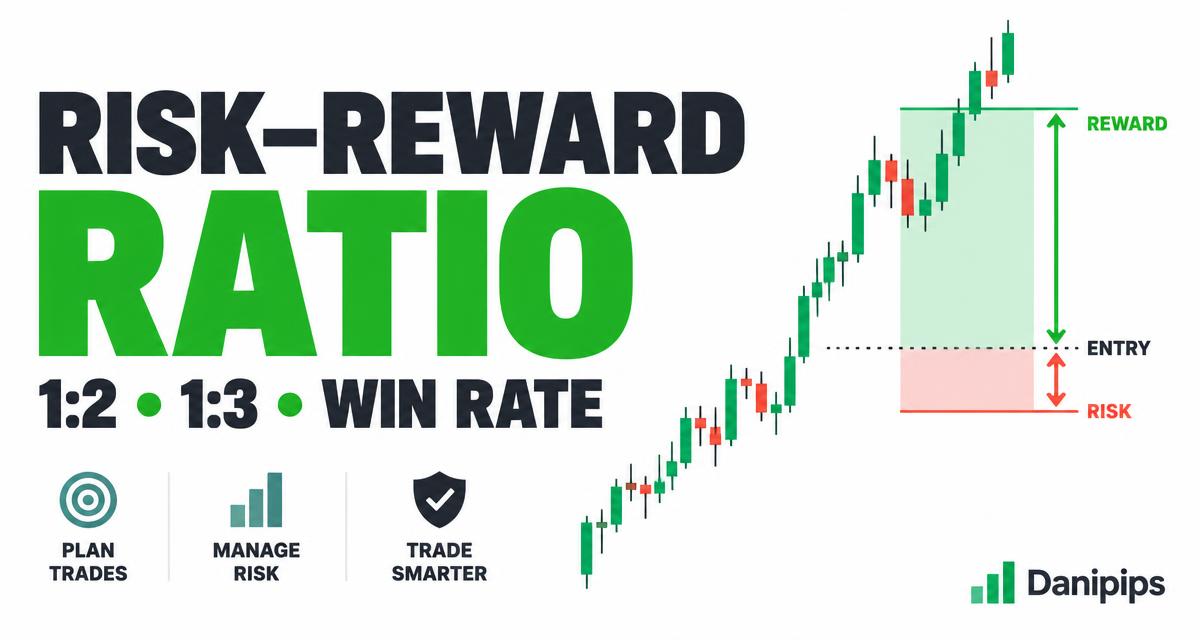
A 1:2 risk–reward ratio means planning to make $2 for every $1 you risk. It does not mean a trade has a two-thirds chance of winning, and it does not guarantee that your target will be reached.
This guide explains how to calculate the ratio, how win rate changes the result, and why trading costs can turn an attractive setup into a poor trade. You will see hypothetical EURUSD and gold examples—not live trade signals.
What is a risk–reward ratio?
Risk is the planned loss between your entry and stop-loss. Reward is the planned gain between your entry and take-profit. Here, 1:2 means risk:reward: risking one unit to aim for two units. Some platforms display reward divided by risk instead, so that same setup appears as 2.0 or 2R. Always check which convention a tool uses.
- 1:1: risk $10 to aim for $10.
- 1:2: risk $10 to aim for $20.
- 1:3: risk $10 to aim for $30.
These are planned outcomes before costs. Slippage, gaps, partial exits and changes to your orders can make the realized result different.
A stop-loss defines an exit instruction, not a guaranteed maximum loss. Learn the order basics in our stop-loss and take-profit guide.
How to calculate risk–reward ratio
For a buy trade:
Risk distance = entry price − stop-loss price
Reward distance = take-profit price − entry price
Reward multiple = reward distance ÷ risk distance
For a sell trade, reverse the price differences: stop-loss minus entry is risk, and entry minus take-profit is reward. Both distances should be positive for a conventional trade plan. A zero risk distance makes the ratio undefined.
Suppose a hypothetical EURUSD buy has:
- Entry: 1.1000
- Stop-loss: 1.0980
- Take-profit: 1.1040
The planned risk distance is 0.0020, or 20 pips. The reward distance is 0.0040, or 40 pips. Therefore, 40 ÷ 20 = 2: the setup has a 1:2 risk–reward ratio.
For this example, assume a USD account, a standard FX contract of 100,000 base-currency units per lot, and a 0.05-lot position. EURUSD pip value is then $0.50 per pip. Planned loss is $10 and planned gain is $20 before costs. Check the actual instrument specification before applying these assumptions to an account.
If pips are unfamiliar, read What Is a Pip?.
Does a 1:2 ratio make a strategy profitable?
No. A planned target is not the same as an achieved average win. You also need to know how often trades win, how large actual losses are, and how much execution costs.
The simplified break-even win rate before costs is:
Break-even win rate = 1 ÷ (1 + reward multiple)
This assumes every loss is exactly 1R and every win achieves the full planned reward:
- 1:1: 50% wins to break even.
- 1:2: approximately 33.33% wins to break even.
- 1:3: 25% wins to break even.
Break-even is not profit. With trading costs, the required win rate rises. Moving the target farther away may increase the advertised ratio while decreasing how often the target is reached.
Consider ten hypothetical trades at 1:2, each risking $10:
- Four wins × $20 = $80.
- Six losses × $10 = $60.
- Result before costs = +$20.
With only three wins and seven losses, the result becomes $60 − $70 = −$10, still before costs. The ratio alone did not decide the outcome.
Ten trades are only an arithmetic illustration, not evidence that a strategy works. Review a larger, representative demo sample that includes different market conditions.
Trading costs can change the effective ratio
Start with planned gross risk of $10 and gross reward of $20. Suppose total round-trip execution costs are $1 per trade, treated as an additional cost that has not already been included in those amounts.
- Net winning outcome: $20 − $1 = $19.
- Net losing outcome: −$10 − $1 = −$11.
- Effective reward multiple: $19 ÷ $11 ≈ 1.73.
- Break-even win rate: $11 ÷ ($19 + $11) ≈ 36.67%.
This is a simplified cost model, not a quote for any broker. Costs may vary with spread, commission, financing, account type, holding time and execution. Slippage may be different on winners and losers.
Do not count spread twice. If your risk and reward calculations already use realistic bid/ask entry and exit prices, part of the cost is already included. Add only costs that are not already represented. Our forex spreads guide explains why chart prices and executable prices can differ.
Gold example: calculate dollars, not a universal “pip”
For a hypothetical XAUUSD buy, assume entry at $2,400, a stop at $2,390, and a target at $2,420. Risk distance is $10 per ounce and reward distance is $20 per ounce: a 1:2 ratio before costs.
If—and only if—the contract specification is 100 ounces per lot, a 0.01-lot position represents one ounce. That produces $10 of planned loss or $20 of planned gain before costs.
Contract sizes, minimum volume and volume steps vary. If an account permits a larger minimum position, the same stop distance may exceed your intended risk budget. Do not tighten a logical stop merely to squeeze a trade into a small account; consider skipping it or practicing on demo.
Read how to calculate lot size on gold and check your platform's symbol specification. Prices here are teaching examples, not current market levels.
Choose the stop first, then the position size
A percentage risk limit and a risk–reward ratio answer different questions:
- Risk percentage: how much of your account you plan to lose if this trade fails.
- Risk–reward ratio: how the potential gain compares with that planned loss.
For example, 1% of $1,000 is $10. Using the earlier EURUSD assumptions and a 20-pip stop, a 0.05-lot position gives $10 of gross planned risk. However, adding costs would exceed a $10 all-in budget. Allow for costs and round volume down to a permitted step, or skip the trade if the minimum position is too large.
The 1% rule is an educational rule of thumb, not a requirement or guarantee of safety. Several correlated positions can create much more combined exposure than one trade suggests. Our position-size calculator helps with the arithmetic; it cannot guarantee fills or make a trade safe.
A practical checklist before opening a trade
- Identify a reason for the setup. Use market structure and support and resistance, not just a visually attractive ratio.
- Choose an invalidation point. Place the proposed stop where the trade idea would no longer make sense, allowing for ordinary volatility and execution conditions.
- Choose a plausible target. A nearby resistance or support area may matter more than a preferred 1:3 label.
- Calculate risk and reward using consistent prices. Check executable prices, costs and contract specifications.
- Size the position within your budget. Check minimum volume, margin requirements and total open exposure.
- Check major news and liquidity. Fast markets can change spreads and fills. Our news-trading guide explains the risks.
- Record the actual outcome. Compare realized average wins and losses—not only the ratio displayed before entry.
Skipping a trade is a valid decision. There is no need to manufacture a setup by moving a stop too close or putting a target beyond any reasonable market structure.
Common mistakes with risk–reward ratios
Confusing ratio with probability. A 1:3 trade does not tell you its chance of success.
Treating a bigger ratio as automatically better. A distant target may rarely fill. Test the trade plan instead of selecting the biggest number.
Moving the stop farther away after entry. This increases risk and changes the original plan. Adding size to a losing trade can increase exposure further.
Ignoring partial exits. Taking part of a position off early changes the weighted average reward. A trade labelled 1:3 may realize much less.
Judging a strategy from a few wins. A short winning streak can occur in a losing strategy. Keep a journal and include costs and losses honestly.
Demo exercise: compare planned and realized R
Record at least 20 demo setups as a learning exercise—not as a sufficient profitability test. For each one, note entry, stop, target, planned dollar risk, expected costs, reason for the trade, and final net outcome.
Realized R = net trade outcome ÷ original planned dollar risk.
If original planned risk was $10 and the final net gain was $15, the outcome was +1.5R. A net loss of $11 was −1.1R. Review whether spreads, early exits, stop changes or slippage explain the difference from your planned ratio.
Frequently asked questions
Is 1:2 the best risk–reward ratio for beginners?
There is no universally best ratio. A 1:2 plan is easy to understand, but its usefulness depends on realistic targets, actual win rate, average realized outcomes and costs. Practice a consistent method before considering live money.
Can I lose money with a 1:3 strategy?
Yes. A low win rate, larger-than-planned losses or execution costs can make it unprofitable. The simplified 25% break-even figure assumes full 3R winners, exact 1R losers and no costs.
Does risk–reward change when I use more leverage?
Leverage does not change the price-distance ratio. A larger position changes the dollar gain and loss. Margin availability is not a safe risk budget, and leveraged trading can produce rapid losses.
What should I learn next?
Start with the free forex course, then practice position sizing and order placement on demo. If you choose to explore a broker, read the Danipips Exness review and verify eligibility, product terms and local requirements. Our Exness referral link is an affiliate link; Danipips may receive compensation if you sign up or trade through it. This does not guarantee any trading result.
Further reading and risk notice
- Investor.gov: Foreign Currency Exchange (Forex) Trading for Individual Investors — leverage and forex risks.
- BabyPips: Reward-to-Risk Ratio and Expectancy — the relationship between outcomes and win rate.
This article is general education, not personalized investment advice or a trade recommendation. Forex and leveraged products involve substantial risk. Stop orders may fill at worse prices than requested, and losses can exceed the planned amount. Use only money you can afford to lose and confirm the rules and protections that apply to your jurisdiction and account.