Trading Tips
Fibonacci Retracement for Beginners: How to Draw and Use It in Forex
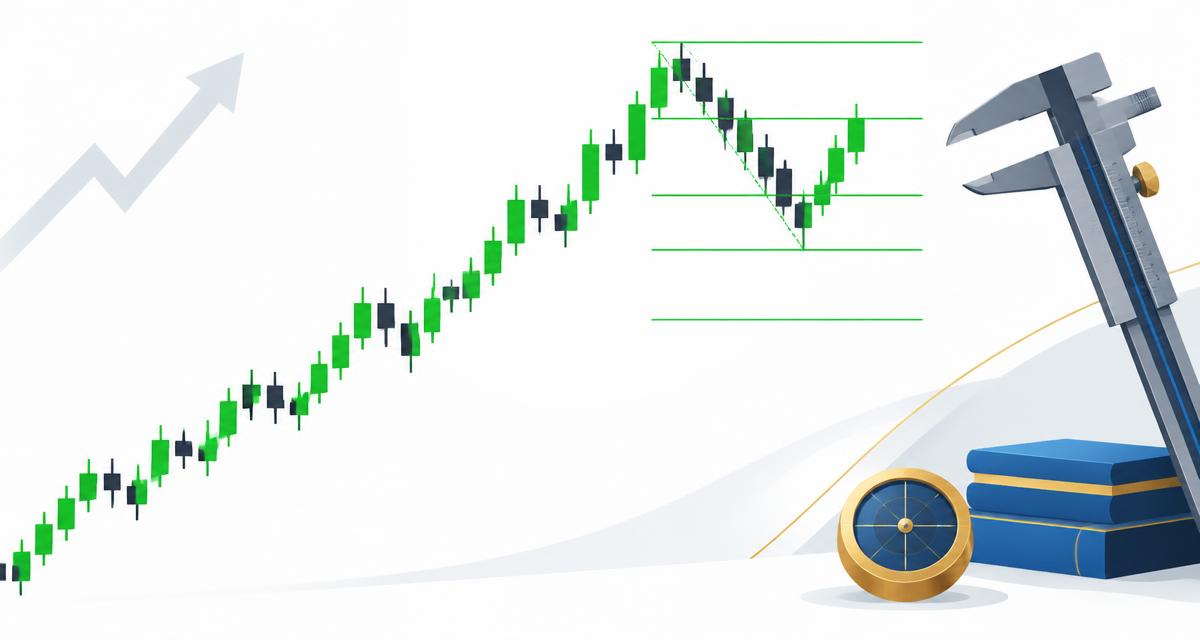
Fibonacci retracement is a chart tool that marks possible support and resistance during a pullback. It does not predict the future. For a beginner, its value is in organizing a trading plan: identifying a clear price swing, marking a few reference levels, and deciding what would invalidate the idea before risking money.
This guide explains how to draw Fibonacci retracement in forex, what the percentages mean, and how to avoid treating every line as a buy or sell signal. All prices below are hypothetical examples, not live recommendations.
What is Fibonacci retracement?
A retracement is a temporary move against the direction of a larger price swing. If EURUSD rises and then gives back part of that advance, traders may measure the pullback using the Fibonacci tool.
Common retracement settings are 23.6%, 38.2%, 50%, 61.8%, and 78.6%. These express how much of the selected swing price has retraced. The 50% level is a widely used midpoint, not a Fibonacci ratio. The other popular settings relate to ratios derived from the Fibonacci sequence; 78.6% is commonly obtained from the square root of approximately 0.618.
These levels are reference areas, not probabilities. A 61.8% retracement does not mean a trade has a 61.8% chance of succeeding. Price can pause, break through, or reverse before reaching any marked level.
Before using the tool, understand support and resistance and basic candlestick patterns.
How to draw Fibonacci retracement in an uptrend
Start with one obvious upward price swing, rather than searching for anchors that make a previous trade look perfect.
- Identify the swing low where the upward move began.
- Identify the swing high where that move ended before the pullback.
- Select your platform's Fibonacci retracement tool.
- Draw from the swing low to the swing high.
- Check that a 38.2% retracement represents a 38.2% giveback of that rise.
Platforms may reverse the displayed 0% and 100% labels or use a reverse setting. Verify the actual prices instead of relying only on label placement. Use the candle wicks consistently for this example, and keep the anchors unchanged while assessing the setup.
For a clear downward swing, draw from the swing high to the swing low and measure the upward pullback from the low. In both directions, the important question is how much of the original move price has given back.
EURUSD example: calculating the levels
Suppose EURUSD rises from 1.0800 to 1.0900. The swing is 0.0100, or 100 pips for this pair.
For an upward swing:
Retracement price = swing high − (swing size × retracement percentage).
- 23.6%: 1.0900 − 0.00236 = 1.08764.
- 38.2%: 1.0900 − 0.00382 = 1.08618.
- 50%: 1.0900 − 0.00500 = 1.08500.
- 61.8%: 1.0900 − 0.00618 = 1.08382.
- 78.6%: 1.0900 − 0.00786 = 1.08214.
If price falls to 1.0850, it has retraced half the selected rise. That is a measurement, not an instruction to buy. For a downward swing, add the chosen fraction of the swing size to the swing low instead.
If the pip calculation is unfamiliar, read what is a pip? first.
A practical beginner framework
1. Start with market structure
Look for a clear trend and a visible completed swing on a timeframe you can follow calmly. Higher highs and higher lows can indicate an uptrend; lower highs and lower lows can indicate a downtrend. An optional moving average can help describe the trend, but it is also lagging.
If price is moving sideways with overlapping swings, Fibonacci anchors become subjective. Skipping the trade is a valid decision.
2. Look for an existing support or resistance area
A retracement level is more useful as a planning reference when it sits near a price area you had already identified. For example, a 50% retracement may overlap with a previous breakout area.
This overlap is often called confluence. It does not establish a guaranteed edge, and several indicators derived from the same price data are not independent evidence.
3. Observe the reaction rather than entering blindly
Instead of placing a trade simply because price touches a line, a demo exercise might require price to reject the area and close back in the original trend direction. Write down the specific condition before the pullback arrives.
Waiting can mean missing the move. Entering early can mean accepting more false signals. There is no setting that removes that trade-off.
4. Define invalidation and position size
Choose an invalidation point based on structure and your written strategy. A stop placed mechanically a tiny distance below a Fibonacci line can be hit by normal price movement. A wider stop requires a smaller position if cash risk stays the same.
Use the position-size calculator and review stop-loss and take-profit planning. Stops may execute at a worse price during gaps or fast markets.
5. Check the potential reward after costs
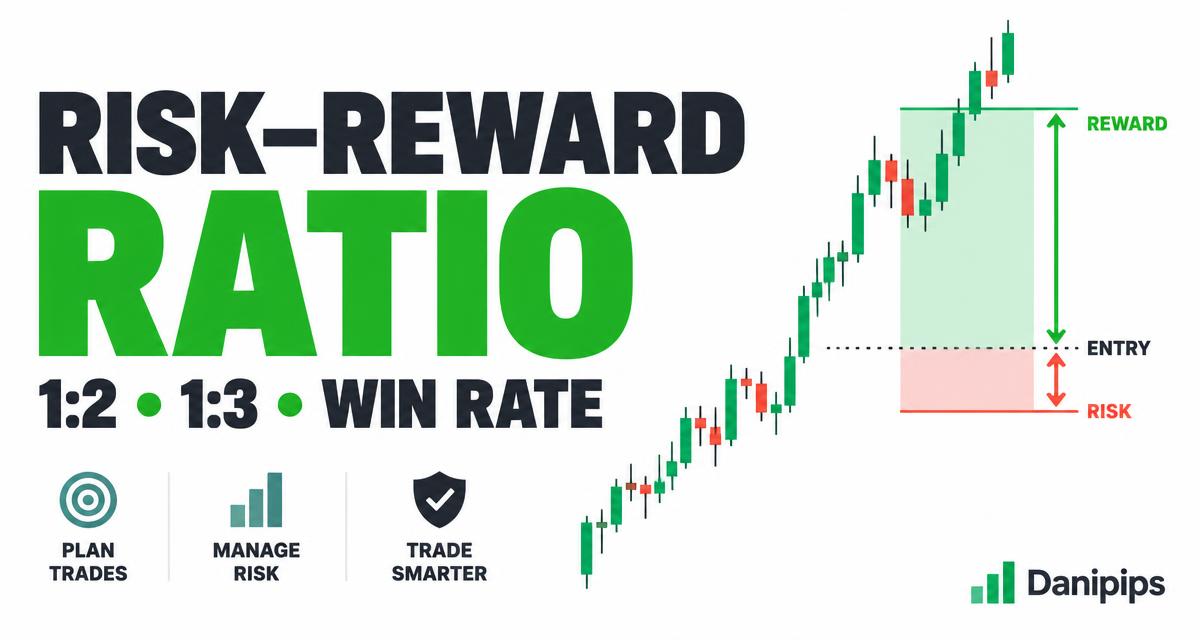
A nearby swing high or low can be a reference for an exit, but it may leave too little room relative to the stop. For a hypothetical 20-pip stop and 30-pip target, gross reward-to-risk is 1.5:1. Spread, commission and slippage reduce the net result. A positive reward-to-risk ratio alone does not make a strategy profitable.
Can you use Fibonacci retracement on gold?
The percentages work the same way on XAUUSD. Suppose gold rises from $2,400 to $2,440 per ounce. A 50% retracement is $2,420; a 61.8% retracement is $2,415.28. These are deliberately hypothetical prices.
However, equal-looking chart movements do not imply equal cash risk across instruments. Gold contract sizes and the broker's definition of a point or pip need checking. Read the gold lot-size guide before applying a forex position-size example to gold.
Five common Fibonacci mistakes
- Changing anchors until the chart looks convincing. This encourages hindsight rather than a repeatable method.
- Using too many overlapping tools. If every possible price is near a line, the plan has little practical meaning.
- Buying or selling every touch. A retracement can develop into a full reversal.
- Ignoring news and trading costs. Major economic releases can overwhelm technical levels; tight targets are especially sensitive to forex spreads.
- Increasing leverage after a loss. A neat chart setup does not justify exposing more of the account.
A simple demo practice exercise
Choose one pair and one timeframe. Record 20 clearly defined historical examples, then observe new examples on a demo account without changing your rules. Save the original anchors, entry condition, invalidation point, costs and outcome, including every losing or skipped setup.
Twenty observations are a learning exercise, not proof of profitability. Historical results, demo fills and live execution can differ. Your first goal is a consistent process, not an income target.
Start with the free forex course. If you are considering Exness for demo practice, read the Exness review and check availability, the serving legal entity and local requirements. Visit Exness through the Danipips referral link. Danipips may earn a referral commission; using the link does not guarantee returns or suitability.
Frequently asked questions
Which Fibonacci retracement level is best?
There is no universally best level. The 38.2%, 50% and 61.8% levels are common reference points, but their usefulness depends on the chosen swing, market structure, execution costs and a tested strategy.
Does Fibonacci retracement work on a five-minute chart?
You can draw it there, but short-timeframe noise and costs can make execution harder. Beginners may find slower charts easier to observe; a slower chart still does not guarantee a winning trade.
What is the difference between retracement and extension?
Retracement levels measure a pullback within a selected swing. Extensions project reference levels beyond a swing and use different settings or anchor conventions. Neither provides a certain future target.
Can Fibonacci retracement guarantee profits?
No. It measures selected price movements; it cannot ensure that price will respect a level. Forex and leveraged CFDs carry a high risk of loss. This article is education, not personalized financial advice.